
Gravimetric Adsorption Energy Distribution
August 8, 2011
Executive Summary
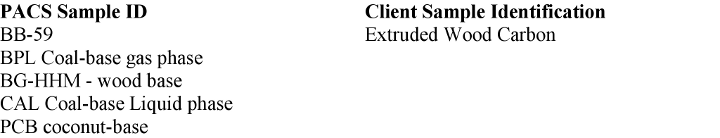
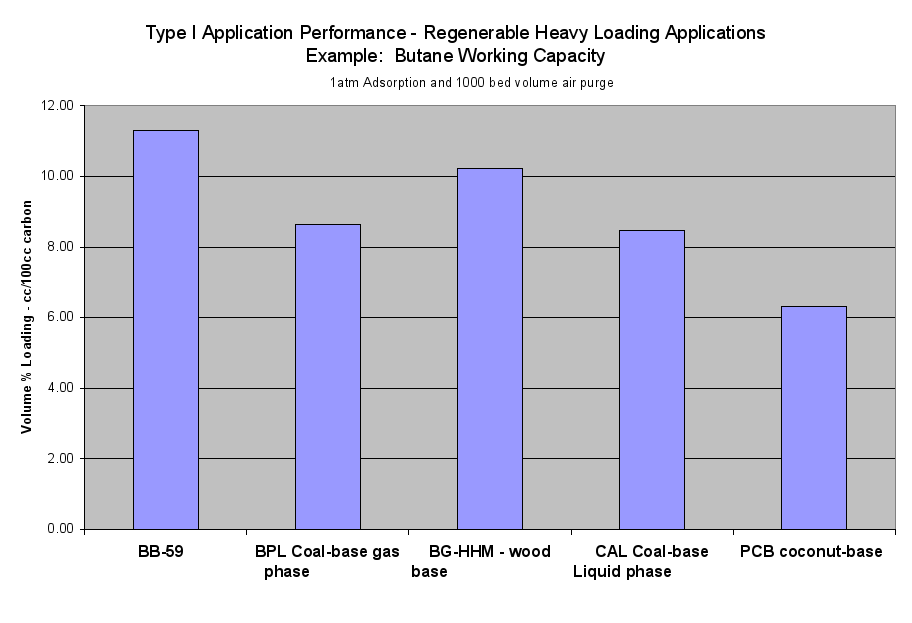
One sample of wood-based pellets was fully characterized for vapor phase comparison using the Gravimetric Adsorption Energy Distribution method (GAED): Extruded Wood Carbon (BB-59). With the Apparent Density (AD) of 0.364 g/cc, a volume-based comparison was made to four reference carbons: BPL Coal-based gas phase, BG-HHM Wood-based, CAL Coal-based liquid phase and PCB Coconut-based carbon. After conditioning, heating the samples to 240ºC in argon and holding for 25 minutes, this extruded wood-based pellet sample lost almost 16% by weight indicating it had been exposed to significant humidity or an oxidizing atmosphere. This sample showed about 1.5 times the total pore volume of the BPL gas phase reference sample and about half that of BG-HHM. The Differential Characteristic Curves showed a remarkably similar structure to that of BG-HHM wood-based reference material. The calculated vapor-phase isotherms showed this material performed better at high concentrations out-performing all but the BG-HHM in MTBE, Benzene and Phenol removal. Graphs and data table 2a of the Six Performance Application Types showed that this carbon out-performed all reference materials in Type I Application Performance such as the Butane Working Capacity. Microscopic photographs of these samples are available upon request.
GAED Results:
Sample BB-59 (Extruded Wood Carbon) was fully characterized by measuring the entire characteristic curves using the GAED. The Apparent Density (AD) of 0.364 g/cc was used allowing volume-based results. This carbon was then compared to four commercially activated reference samples made from a range of raw materials.
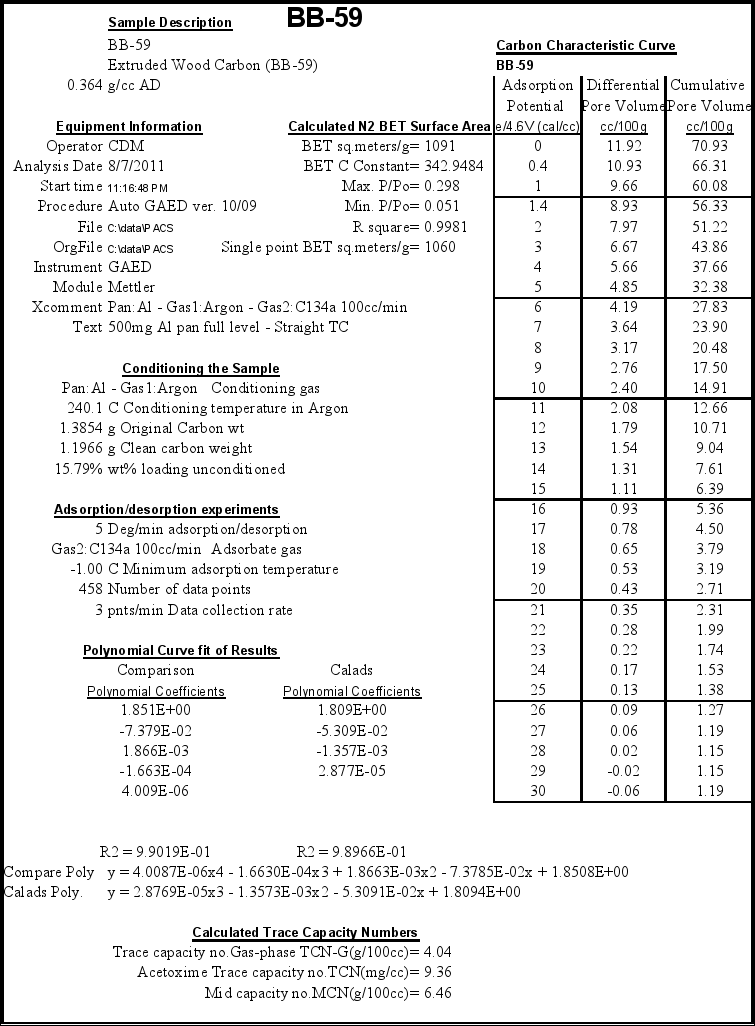
The sample was run in small pellet form. A summary of the actual test data and conditions used is listed in the data summary table at the end of the report in Appendix A. The BB-59 sample lost 15.79 weight percent on conditioning (heating to 240ºC in argon and holding for 25 minutes). Losses of less than 8 percent indicated a well-stored sample that had been protected from the small amount of moisture pick-up from ambient air during handling and storage and was also fresh and not oxidized. This sample had over twice this weight loss indicating either a spent carbon or one that was not protected (stored in a proper container) from oxidation or picking up humidity. All activities and adsorption capacities were calculated on a clean carbon basis. To observe these capacities in the field may require additional processing of the carbon on site.
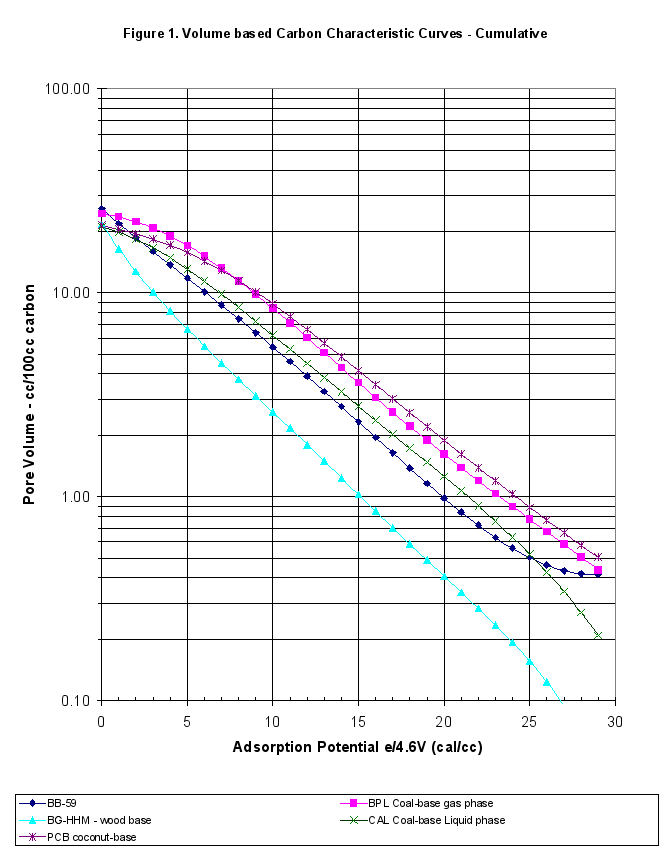
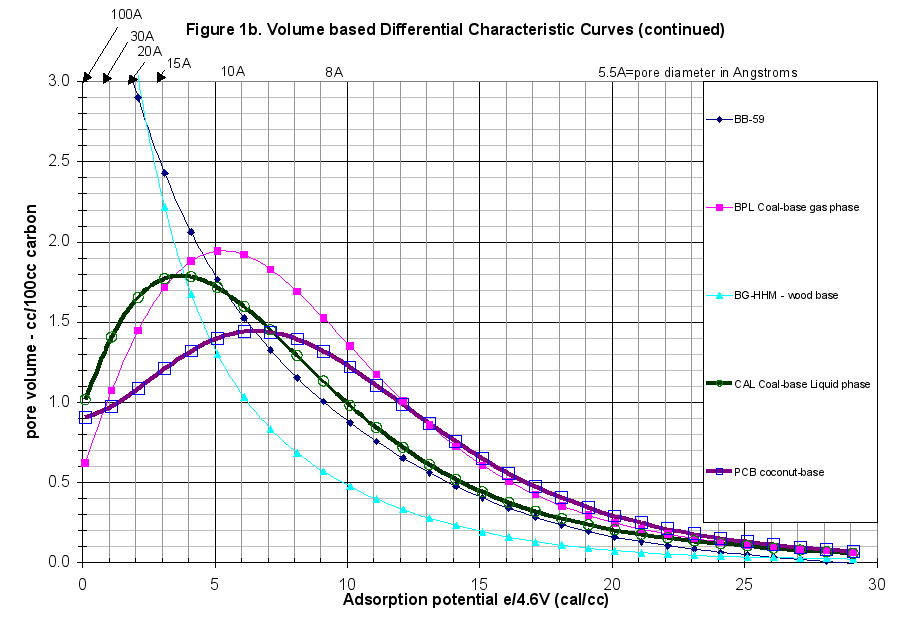
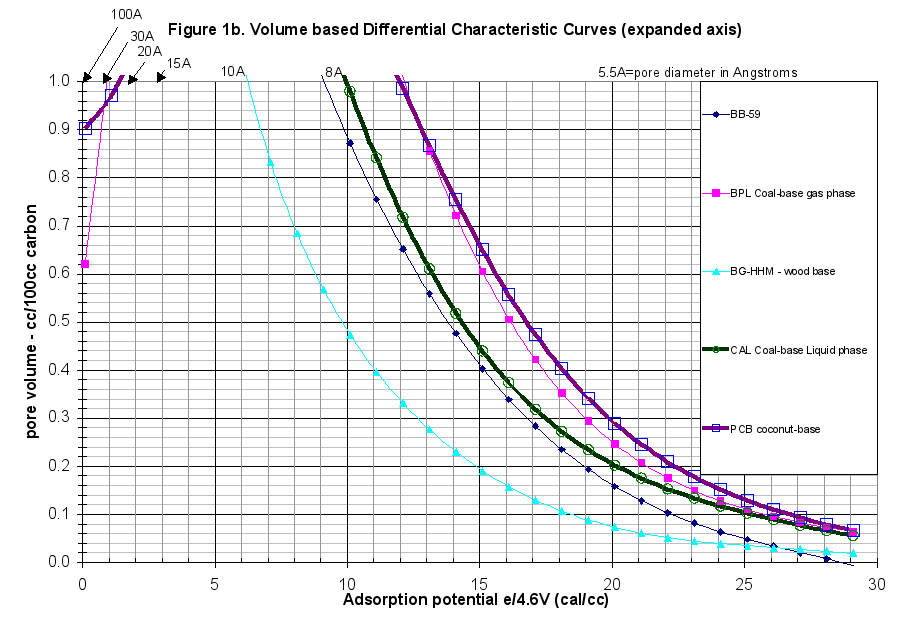
The GAED run was typical. The difference between the adsorption and desorption curves was minor throughout the experiment, therefore there was no hysteresis present, as was normal for commercially activated carbons. This report extended the comparison of this carbon beyond just the presentation of the characteristic curves. The plots of the differential and cumulative characteristic curve data are presented in Figures 1 and 1b in a volume-based comparison. Weight-based comparisons are also available. The specific run data and results are attached as Appendix A.
GAED Raw Data
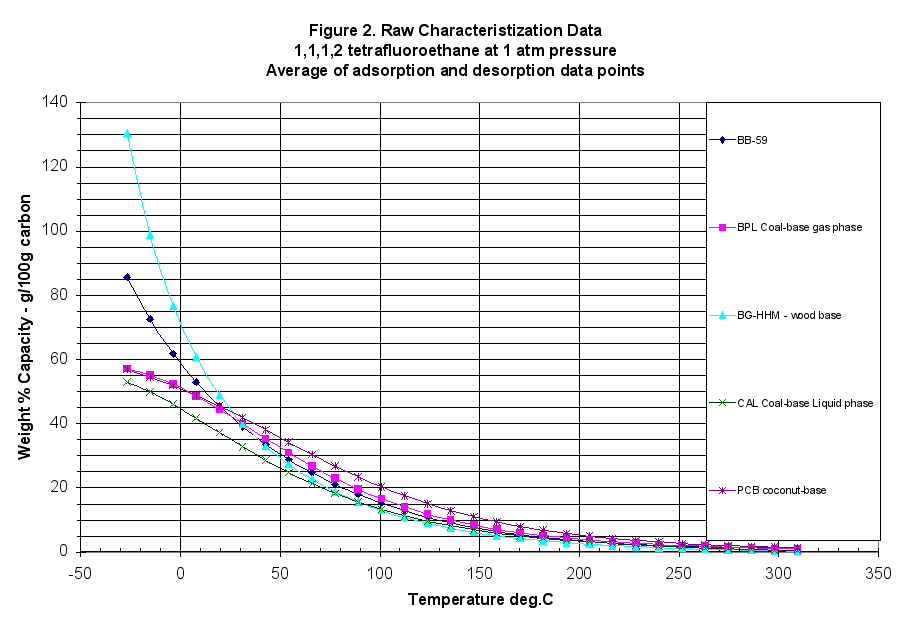
The GAED (gravimetric adsorption energy distribution method) measured over 450 adsorption and desorption data points covering seven orders of magnitude in relative pressure (isothermal basis) and three orders of magnitude in carbon loading. The mass adsorbed was also divided by the carbon mass to generate a weight percent loading for easier comparisons. The raw data was plotted in Figure 2. At 240ºC, the adsorbent gas C134a or 1,1,1,2-tetrafluoroethane was introduced and the loading increased. Note in Figure 2, the mass loading was plotted against temperature but the relative pressure was also changing. There were three variables affecting performance that changed from point to point: vapor pressure, partial pressure, and temperature.
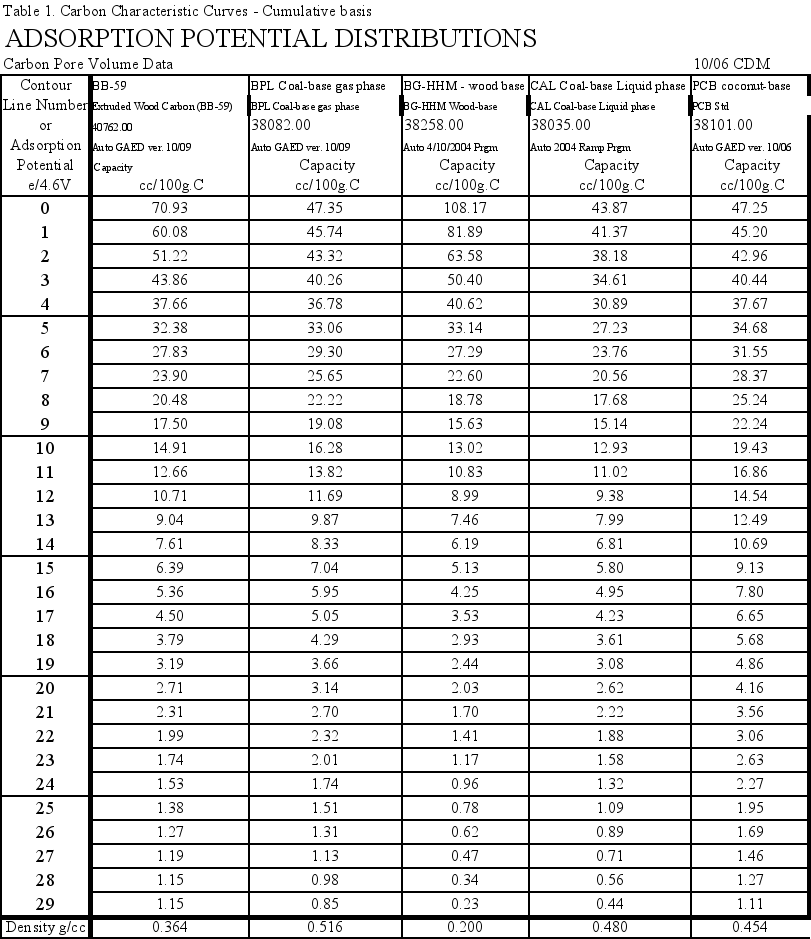
To make comparisons easier, the large data file of adsorption/desorption points at different temperatures and relative pressures was simplified. First the data was interpolated to get 30 evenly spaced points covering the entire data range. Next the adsorption and desorption results were averaged to get the equilibrium values (the difference between adsorption and desorption was minimal for this sample – no hysteresis). The y-axis was converted to pore volume measures, in cc liquid adsorbed or cc pores filled/100grams carbon, instead of weight percent. The average interpolated data for these characteristic curves is presented in Table 1, and Figures 1 and 1b.
Performance Prediction Models
These curves were the only carbon related information required to predict physical adsorption performance using Polanyi Adsorption Potential theory. These single and multicomponent, gas and liquid phase, computer models were used to predict carbon performance and are available from PACS. To do performance predictions the following polynomial describes these carbon samples:
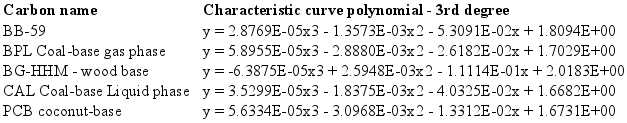
In the equation, y was the common logarithm of pore volume in cc/100g carbon and x was the e/4.6V adsorption potential in cal/cc. Characteristic curve polynomials are also listed in Appendix A.
Performance in the Six Types of Applications
The simplest comparison of carbon for a specific application was to run the performance prediction calculations for specific conditions, concentrations, and components present in the application. However, our experience with years of carbon optimization and performance comparisons has found that all physical adsorption applications can be placed into six application types. The proof is part of a 16-hour/800 slide-training course on carbon fundamentals given by PACS at least once a year.
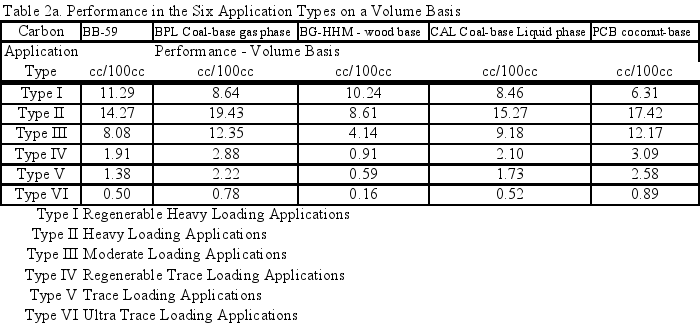
The comparative results in Table 2a demonstrated the value of the different carbons for use in the different types of applications on a volume basis. For a given application type, the results were related to the amount of carbon required to get a certain level of performance. Therefore, a carbon with twice the cc/100g adsorption performance in an application type required half the pounds of carbon to achieve a level of performance in that application type.
Table 2a compared performance on a volume basis and gives the values of the comparative results for the sample carbons versus the performance for the standard commercial carbons for the six application types. These results can also be provided on a weight basis if desired.
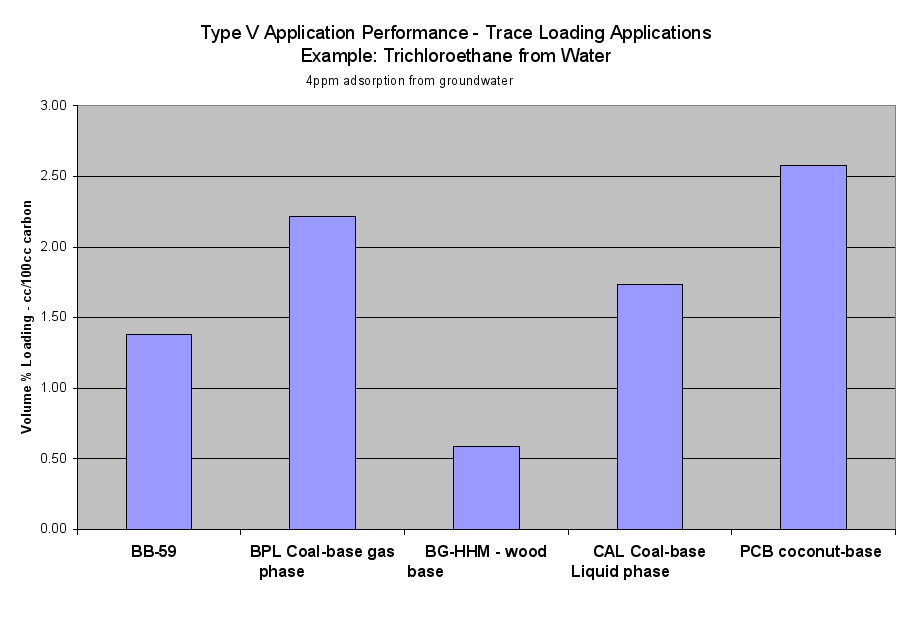
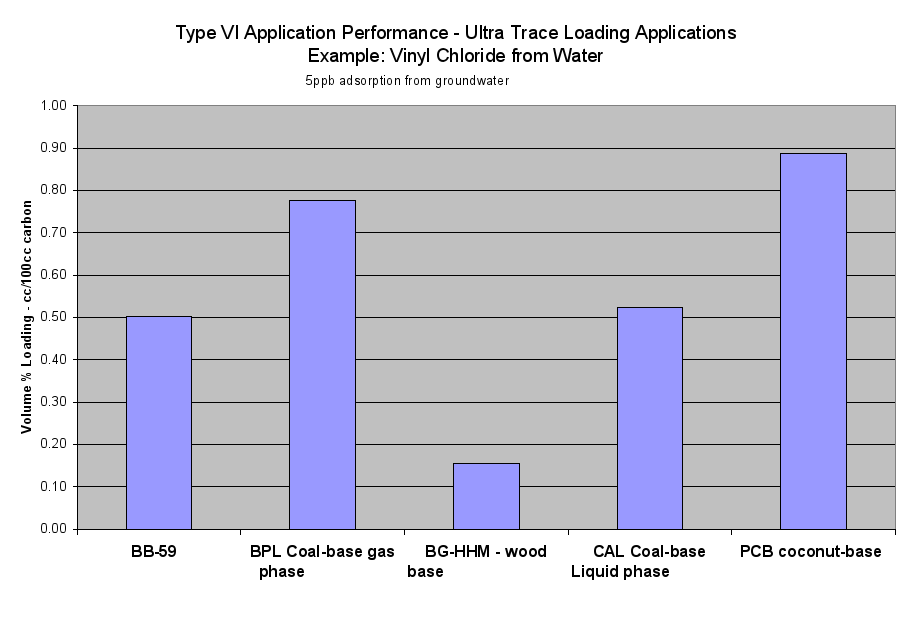
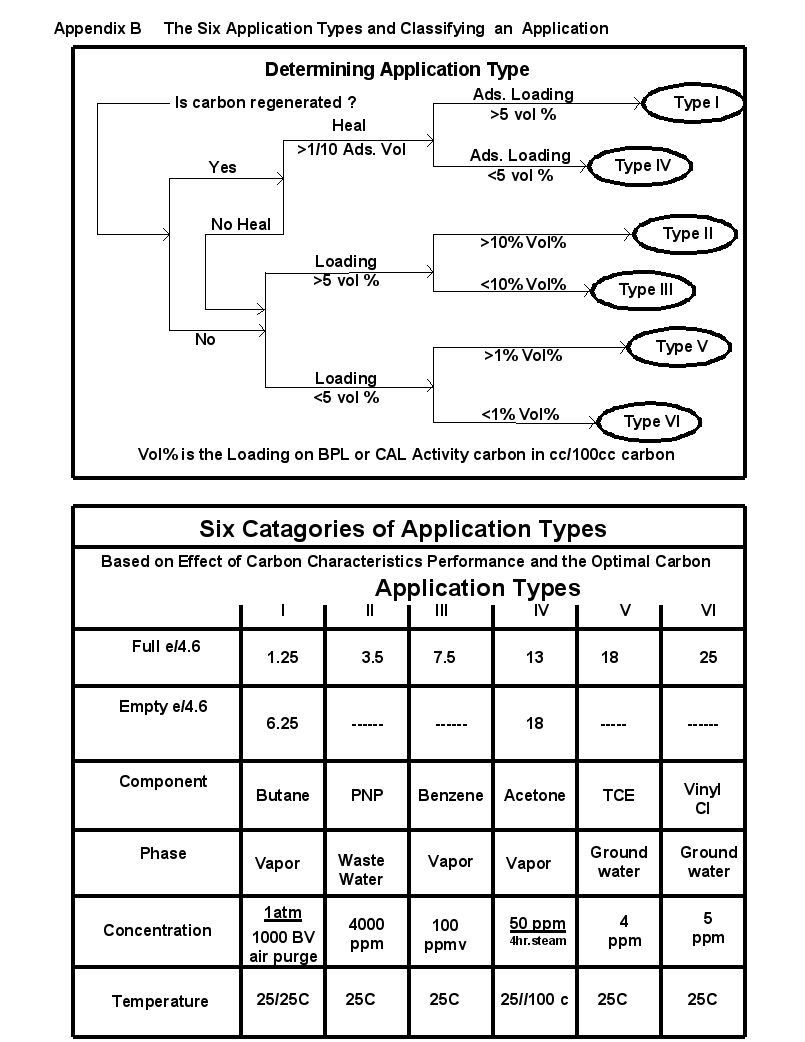
A series of two slides are attached as Appendix B, which described the 6 application types and the classification process to determine what was the application type. Wastewater applications tend to be Type II or Type III. Municipal water purification varied from Type III, Type IV or Type V applications. Removal limits are not low enough and analytical testing is not sensitive enough at this date for Type VI. (Purifying hydrogen of CO and N2 at room temperature is one of the few current Type VI applications). Municipal plants with surface water sources tend to be Type III or Type IV. Plants with ground water sources tend to be Type IV or V.
Trace Capacity Numbers
The characteristic curves were used to predict the values for the acetoxime trace capacity (TCN), gas-phase trace capacity number (TCNG) and mid capacity number (MCN). These results are presented at the bottom of the summary pages in Appendix A.
Adsorption Isotherms
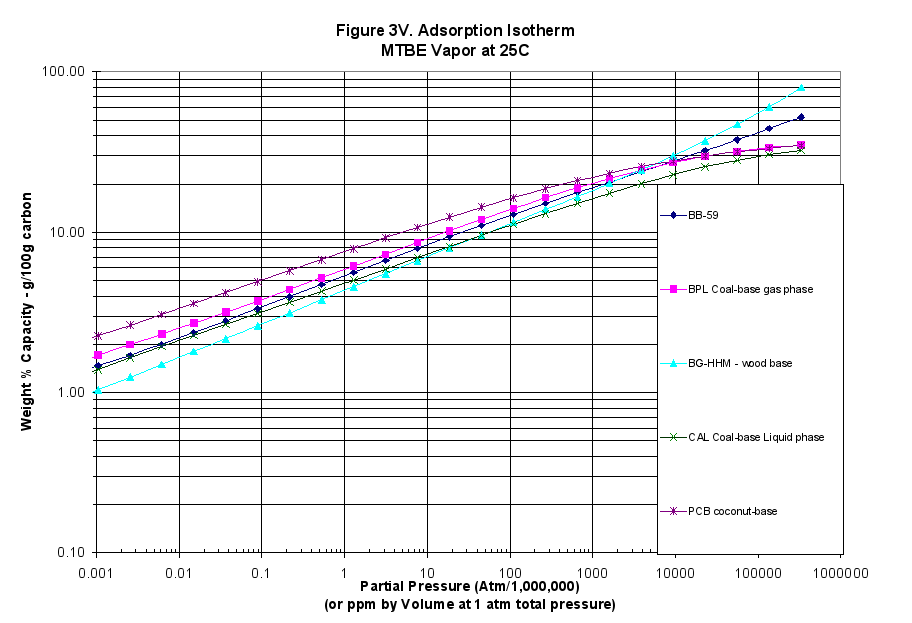
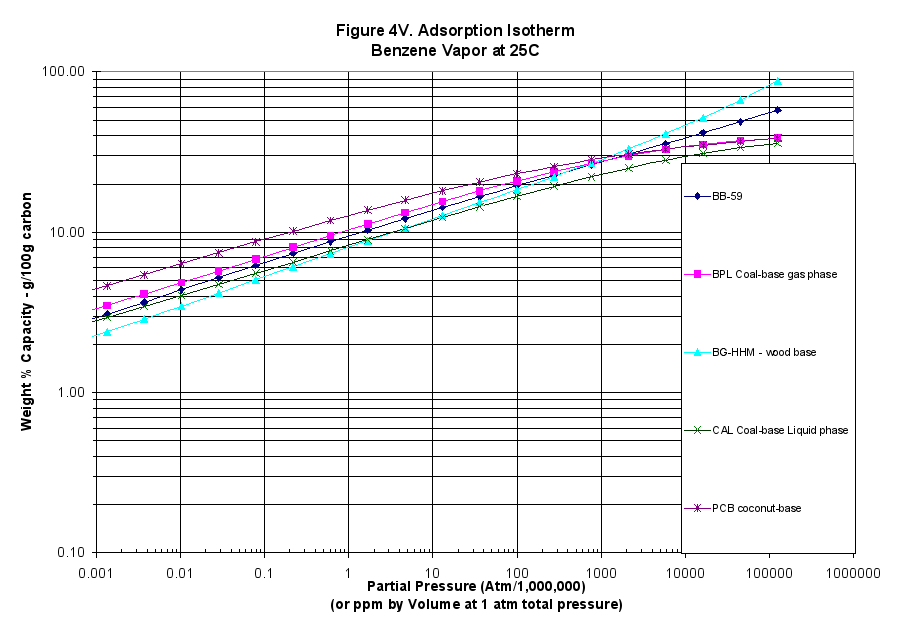
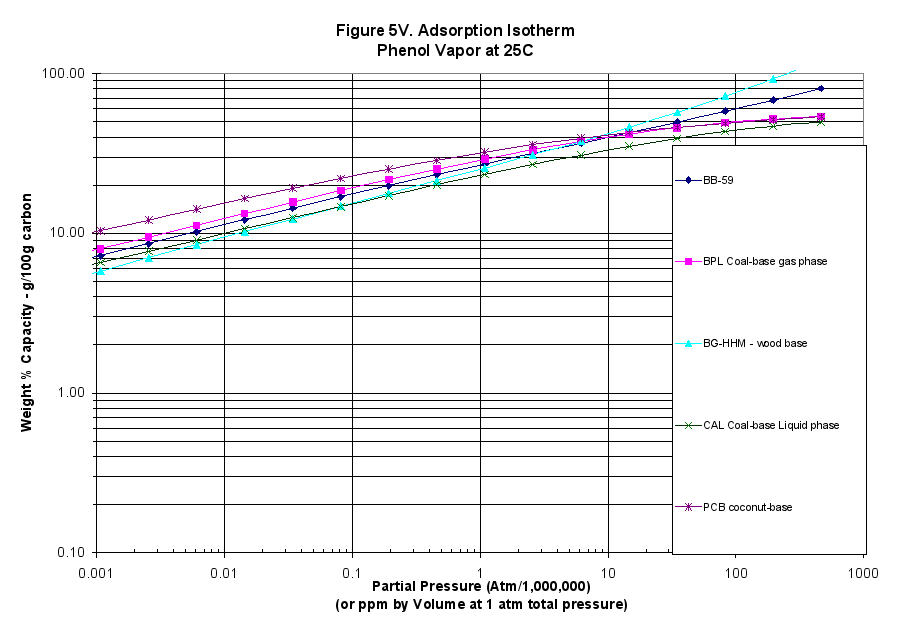
The characteristic curves were also translated into adsorption isotherms using the programs mentioned above: Figure 3 for MTBE (weakly adsorbed material), Figure 4 for benzene (more strongly adsorbed species) and Figure 5 for phenol at pH=7 (quite strongly adsorbed material).
Pore Size Distributions
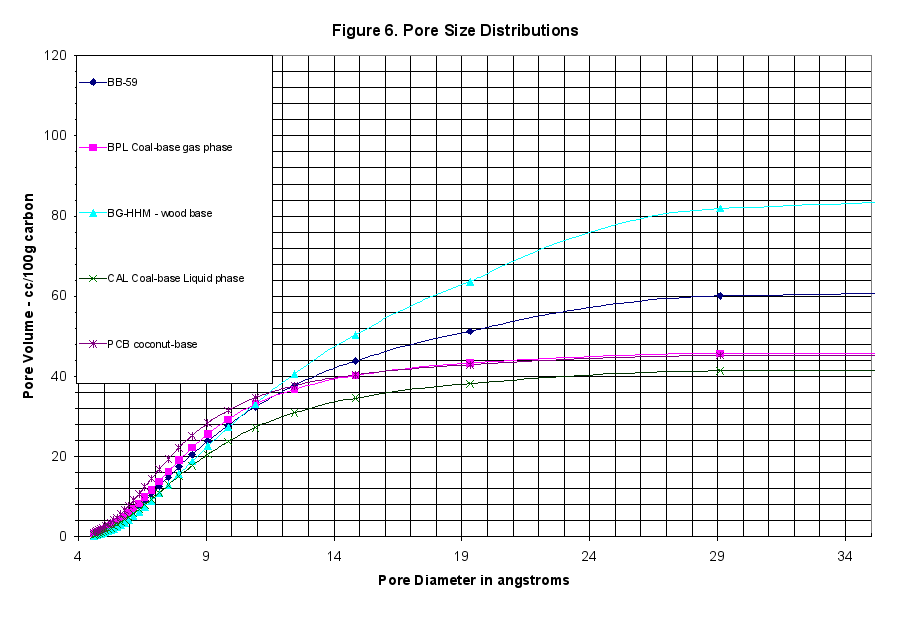
The Kelvin equation, modified by Halsey, can be used to convert the characteristic curve data to calculated BET surface areas or pore size distributions. This was not useful in terms of performance evaluations, but some audiences are more comfortable with the concepts of pore radius and a series of capillary sizes when thinking about activated carbon. Figure 6 showed the cumulative pore size distributions, which we included but find of little use. The single and multi point BET surface area was calculated from these curves and is presented in the Summary Tables in Appendix A.
Interpretation of the GAED results:
- One sample of extruded wood-based pelleted carbon was fully characterized for vapor phase comparison by the GAED (gravimetric adsorption energy distribution method): Extruded Wood Carbon (BB-59).
- The sample was compared to four commercially available reference carbons on a vapor phase basis: BPL Coal-based gas phase, BG-HHM Wood-based, CAL Coal-based liquid phase and PCB Coconut-based carbon of about 1200 iodine number.
- The sample AD of 0.364 made volume-based comparisons possible.
- Extruded Wood Carbon (BB-59) lost almost 16% by weight on conditioning indicating it had been exposed to significant humidity or an oxidizing atmosphere. (Data Summary Table Appendix A).
- Conditioning is the process of heating the sample to 240ºC in argon and holding for 25 minutes that allowed all activities and adsorption capacities to be calculated on a clean carbon basis.
- These pellets had 70.9 cc/100g C total pore volume, which was about 1.5 times higher than BPL Coal-based, gas phase reference carbon at 47.35 cc/100g C but only half that of the BG-HHM reference.
- The calculated BET surface area was 1091 sq.meters/g (Data Summary Table Appendix A).
- The Differential Characteristic Curves showed the structure of this carbon to be remarkably similar to the BG-HHM wood-based reference material (Figure 1b).
- The calculated vapor-phase isotherms for MTBE, Benzene and Phenol showed this material performed better at high concentrations and out-performed all but the BG-HHM reference sample at high concentrations (Figures 3V, 4V and 5V).
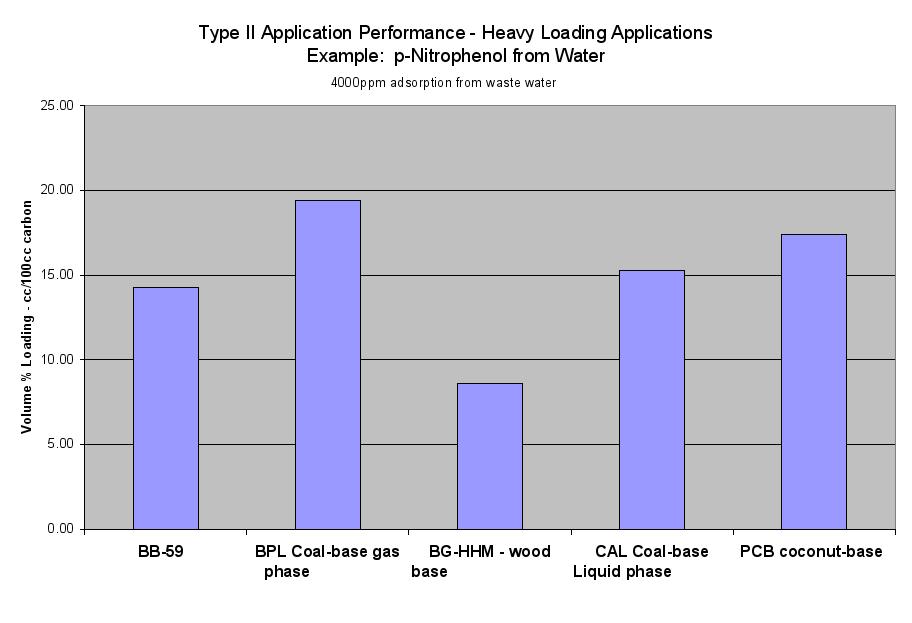
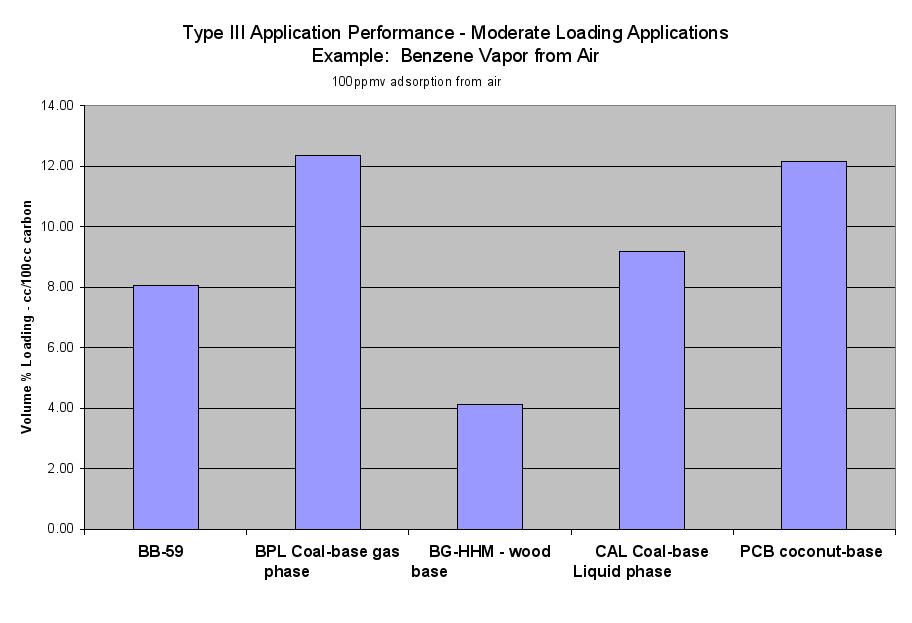
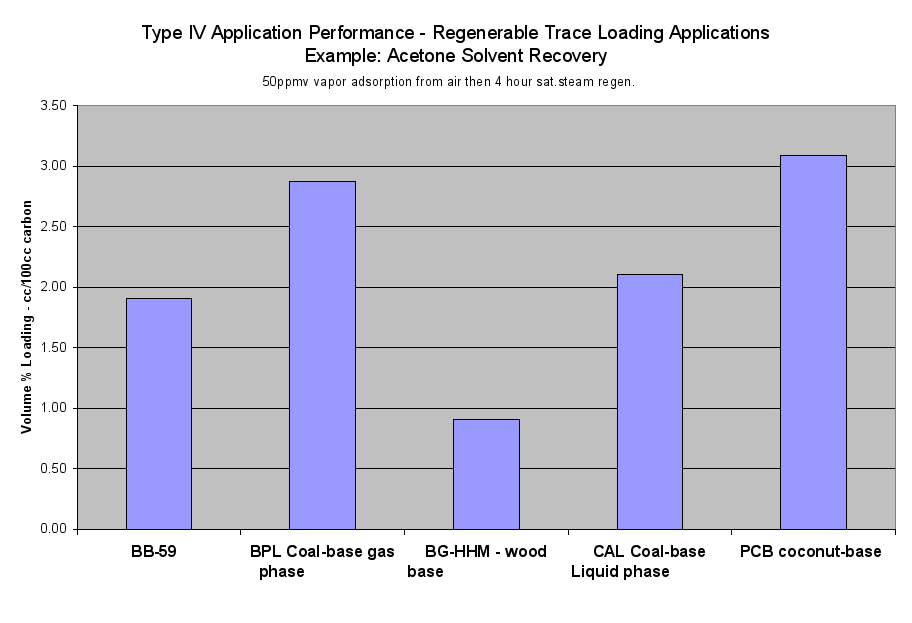
- Table 2a (the Performance of the Six Application Types on a Volume Basis) and the six Application Performance graphs showed how this carbon would do compared to the reference samples. The Extruded Wood Carbon (BB-59) showed its best performance in Type I -Regenerable Heavy Loading Applications like Butane Working Capacity. For the rest of the Application Types, this carbon’s performance was about average compared to the reference material in Type II (Heavy Loading Applications like p-Nitrophenol from Water), Type III (Moderate Loading Applications like Benzene Vapor from Air), Type IV (Regenerable Trace Loading Applications like Acetone Solvent Recovery), and Type V (Trace Loading Applications like Trichloroethane from Water) and Type VI (Ultra Trace Loading Applications like Vinyl Chloride from Water.
- Microscopic photographs of these samples are available upon request.
Appendix A.
GAED Summary Tables
For other laboratory testing service, method development, R&D, software or consulting service needs, contact:
George@pacslabs.comTELEPHONE: (+1)
For Carbon Conferences or Short Courses in public sessions or at your time and place, contact us.
PACS provides testing, courses and consulting at the client's time and place, and twice a year carbon conferences.
PACS Positions Available:
- Laboratory chemist for activated carbon group. Will train!
PACS has positions available for professional scientific service providers and has provided these services for over 38 years. PACS will accept proposals for short courses, consultants, activated carbon conference directors for focused conference subjects, and other needed services. New ideas are welcomed.
PACS, Inc.
409 Meade Drive
Coraopolis, PA 15108
PACSlabs.com